The Open Source Renewable Energy Data Warehouse : Part 2
In this second part, now that our Proof of Concept is online, I'm giving an explanation of the core functionality of this free open source tool : how Candy's user interface works, the metrics that are used and how data is gathered.
When I started to list out the key metrics required, I was just looking at building an application for Battery Energy Storage Systems (BESS), however upon advancing in the design I realised that many of the core metrics could be shared with other types of renewable energy asset (Solar PV and wind) and it would make sense to open the database to deal with all asset types. This seemed especially relevant as operators of solar and wind parks tend increasingly to manage batteries also.
The resulting application, which we are showing here for the first time, is the Renewable Asset Data Analytics or RADA for short.
We needed to split the data between master data (the asset type, its name, location, identifier, maximum capacity etc) and actual real time recorded data.
The asset master table allows all asset types to be stored. The main master metrics that we are interested in for an asset are:
Maximum Power Rate: This is the theoretical maximum power that an asset can provide to a grid at a given moment, depending on the specifications of the manufacturer. For the purposes of this application, this is measured in Megawatts (MW).
Maximum Charge Rate: This metric only applies to batteries and describes the theoretical maximum rate at which a battery can absorb power from the grid.
Maximum Capacity: Measured in Megawatt Hours (MWh), this is the maximum energy storage capacity of a battery and does not apply to solar or wind assets.
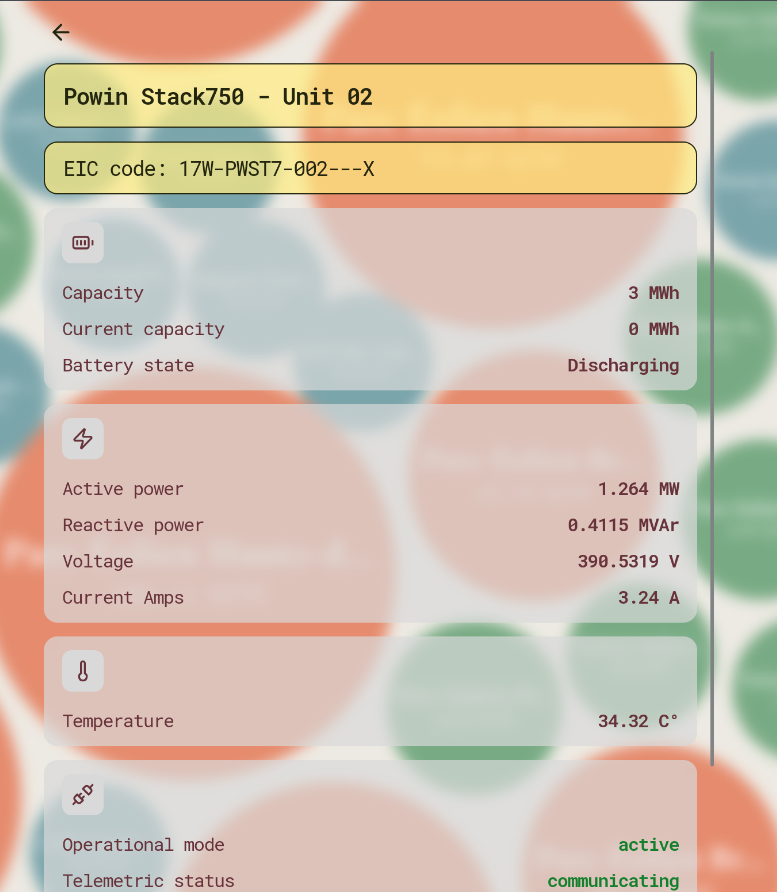
We also give each asset a unique system number and attribute it an EIC (Energy Identification Code) — the European grid's equivalent of a passport number for power infrastructure — for assets that we are tracking on the grid, along with a physical description. For non-grid tracking, another identifier code can be used in its place. Multiple assets can share the same EIC code.
Once we establish what assets we have, the system allows us to maintain operational information on each asset, recorded continuously throughout the day with readings captured every 10 minutes. Currently, the system provides an API for an asset to push information to the system on a regular basis. However, we also envisage extending this functionality to include pulling information directly from different assets.
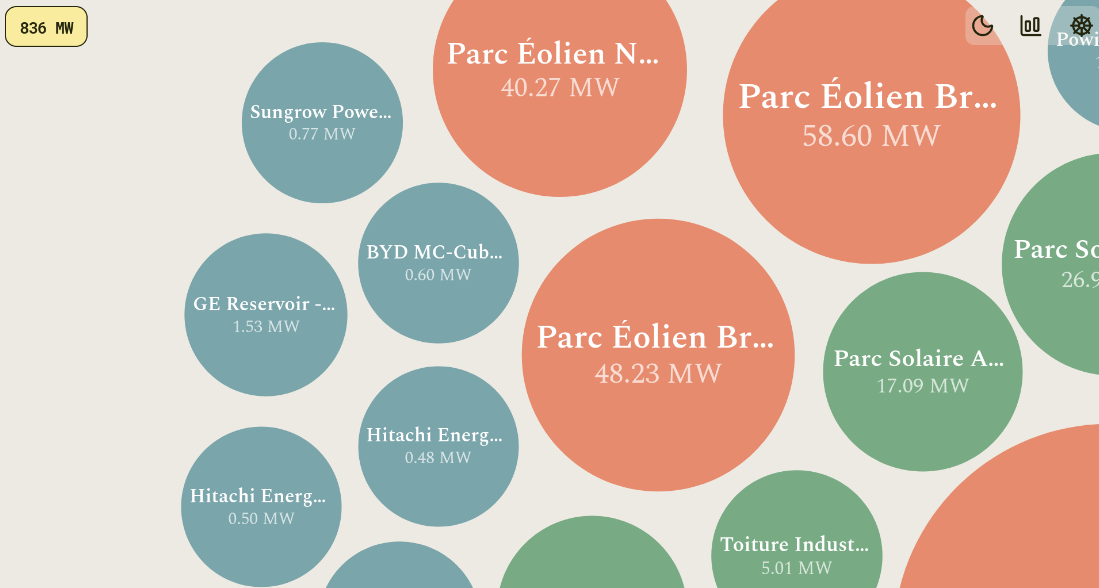
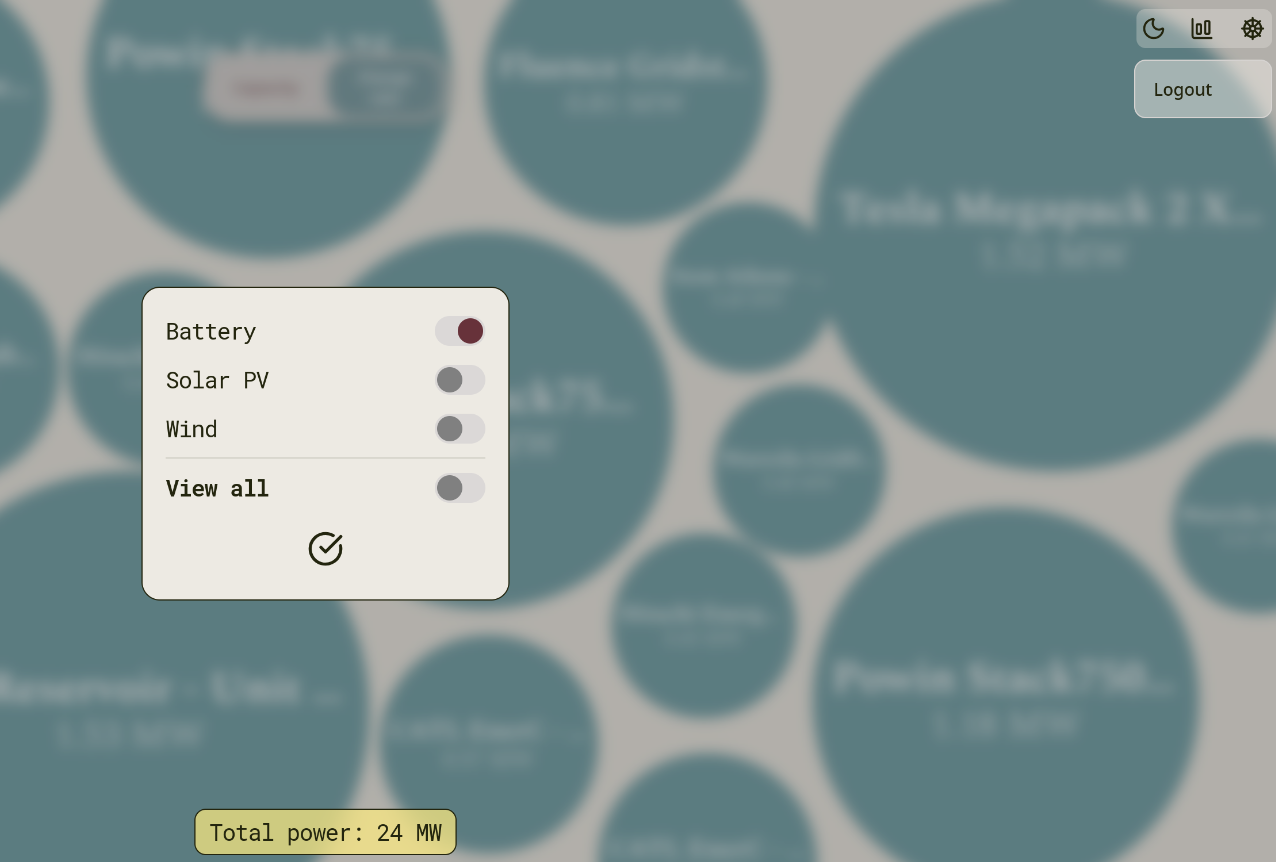
When a user logs on, they immediately see the fleet of assets being managed, represented by balls of different sizes reflecting their comparative current charge or discharge to the system. The user can change the view to select only certain asset categories, and if they select batteries they can see the current amount of energy stored across the fleet. A combined total asset amount is also displayed on the screen.
The colour of each ball indicates whether the asset is communicating normally or whether no recent telemetry is available.
The application itself can also be switched between light and dark mode by the user.
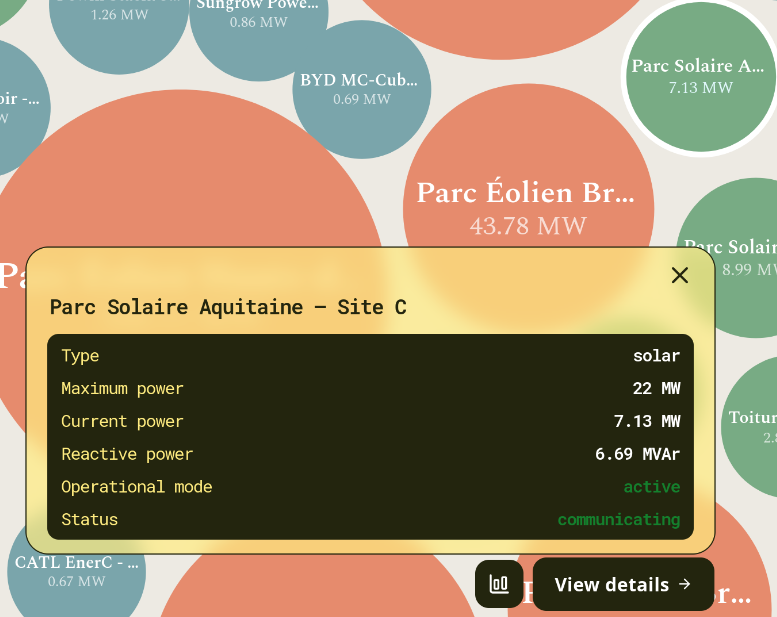
Upon highlighting an asset, further information is available for the current moment, with the option to plot this information over a time period that the user can define.
Power (MW — Megawatts): The rate at which an asset is generating or consuming energy at any given moment — positive when pushing energy to the grid, negative when absorbing it. This applies to all asset types, though for solar and wind the value is always positive as they can only generate, never charge.
Energy Stored (MWh — Megawatt-hours): The total amount of energy currently held inside a battery, ready to be dispatched to the grid. This metric does not apply to solar or wind assets, which generate electricity in real time rather than storing it.
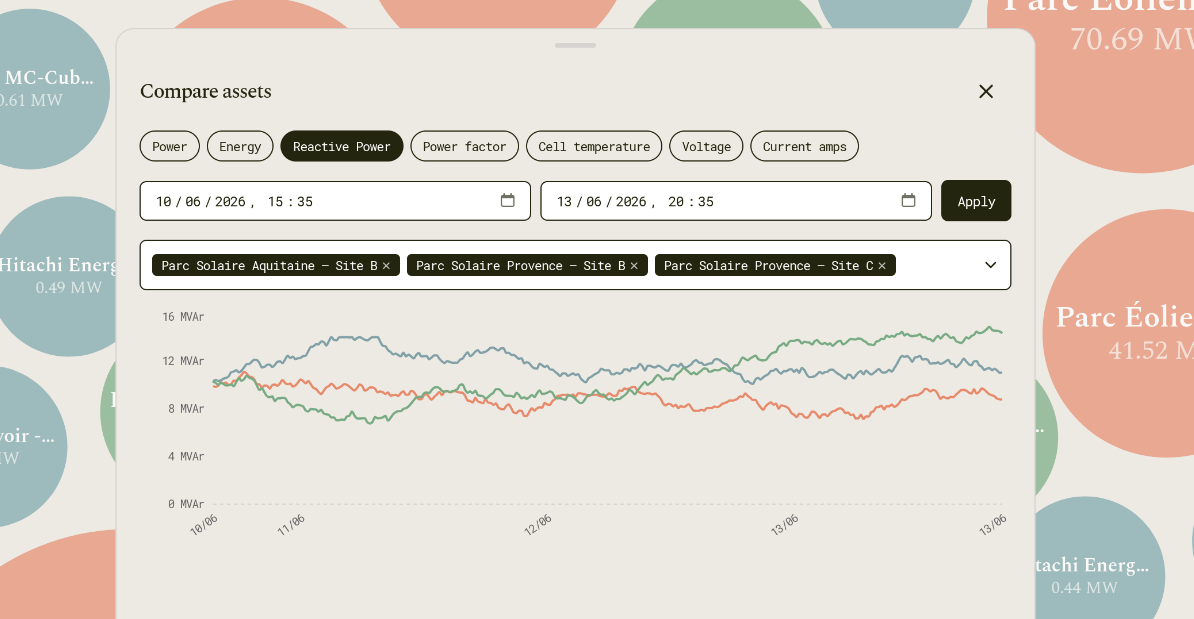
Reactive Power (MVAr — Megavolt-Amperes reactive): A measure of the power circulating in the grid to maintain voltage stability, distinct from the power that does actual useful work. All asset types can contribute reactive power through their inverters, making it relevant across batteries, solar, and wind.
Power Factor: A number between -1 and 1 describing how efficiently an asset is delivering power, where 1.0 means all output is doing useful work with nothing wasted on reactive circulation. It applies to all asset types and is often a contractual requirement that operators must maintain within agreed limits.
Temperature (°C): A temperature reading captured with every telemetry snapshot, reflecting how hard the asset is working at that moment — batteries in particular show a clear rise in temperature during heavy discharge cycles. For solar and wind assets this reflects ambient conditions rather than internal load.
Voltage (V — Volts) and Current (Amps): Voltage measures the electrical pressure driving power through the system, while current measures the flow of electrons — together they determine the power being delivered. At grid metering level these are most meaningful for batteries; for solar and wind farms, power in MW is the primary measurement used by grid operators, and the voltage and current figures reflect internal inverter characteristics rather than a grid-level quantity.
RADA front-end application also allows a user to analyse each of the metrics over a time period either just for one asset or comparing several other assets. So as not to provide too many data points to the front end, if a user requests data extending over a long period of time the API will average the data points in the database and return always no more than 250 data points to be represented graphically. If the user zooms in on a period then the data points can be drilled down as far as the actual readings themselves.
To test RADA, we have created two pieces of functionality: a seeding script which populates the database with the assets and 30 days of test data based on a number of realistic factors but with an element of randomness, and a simulation application which generates fresh telemetry data every 10 minutes and sends it to the application's main telemetry API. This simulation is activated simply through a setting in the application. As the simulated data is generated fresh every 10 minutes, there can occasionally be slight discontinuities at the point where the historical seed data ends and the live simulation begins.
Now that we have a working application online as a Proof-of-Concept, we are now putting together a road-map of key functionality which needs to be developed. This will be the subject of the next post.